NCERT Solutions for Class 12 Maths Chapter 12 - Linear Programming - Miscellaneous Exercise
Access Exercises of Class 12 Maths Chapter 12 – Linear Programming
Exercise 12.1 Solutions 10 Questions
Exercise 12.2 Solutions 11 Questions
Miscellaneous Exercise On Chapter 12 Solutions 10 Questions
Exercise Miscellaneous
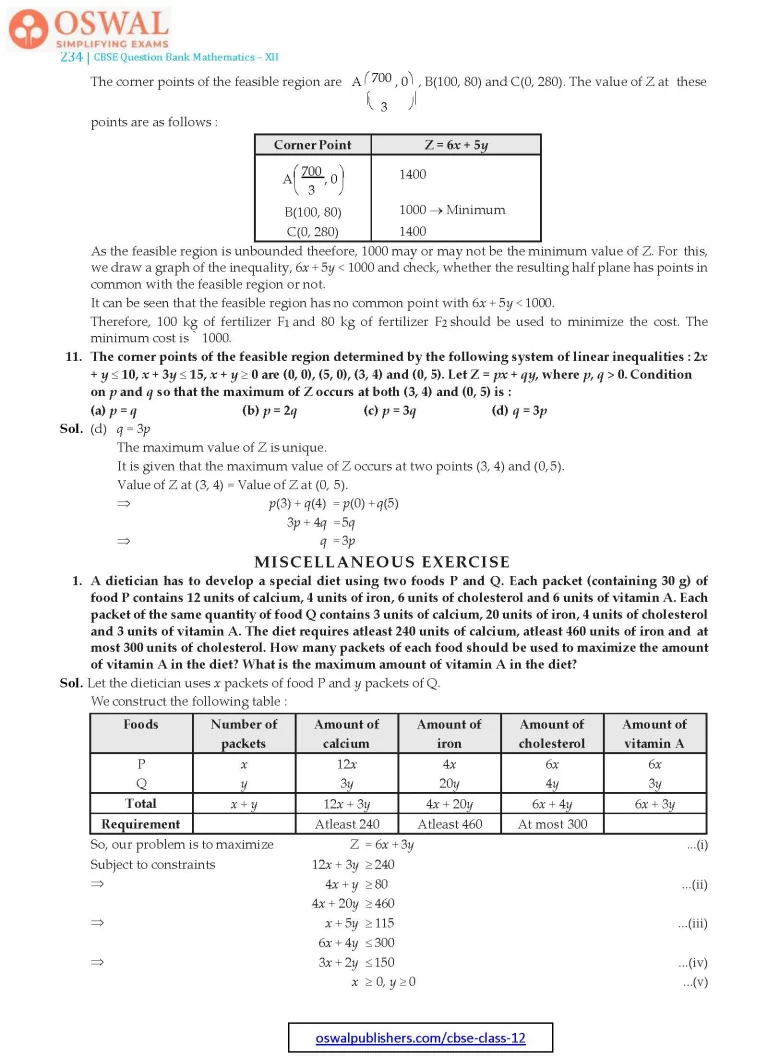
1. A dietician has to develop a special diet using two foods P and Q. Each packet (containing 30 g) of food P contains 12 units of calcium, 4 units of iron, 6 units of cholesterol and 6 units of vitamin A. Each packet of the same quantity of food Q contains 3 units of calcium, 20 units of iron, 4 units of cholesterol and 3 units of vitamin A. The diet requires atleast 240 units of calcium, atleast 460 units of iron and at most 300 units of cholesterol. How many packets of each food should be used to maximize the amount of vitamin A in the diet? What is the maximum amount of vitamin A in the diet?
Sol. Let the dietician uses x packets of food P and y packets of Q.
We construct the following table :
| Foods | Number of packets | Amount of calcium | Amount of iron | Amount of cholesterol | Amount of vitamin A |
| P Q |
x y |
12x 3y |
4x 20y |
6x 4y |
6x 3y |
| Total | x + y | 12x + 3y | 4x + 20y | 6x + 4y | 6x + 3y |
| Requirement | Atleast 240 | Atleast 460 | At most 300 |
So, our problem is to maximize
Z = 6x + 3y ...(i)
Subject to constraints
12x + 3y ≥ 240
⇒ 4x + y ≥ 80 ...(ii)
4x + 20y ≥ 460
⇒ x + 5y ≥ 115 ...(iii)
6x + 4y ≤ 300
⇒ 3x + 2y ≤ 150 ...(iv)
x ≥ 0, y ≥ 0 ...(v)
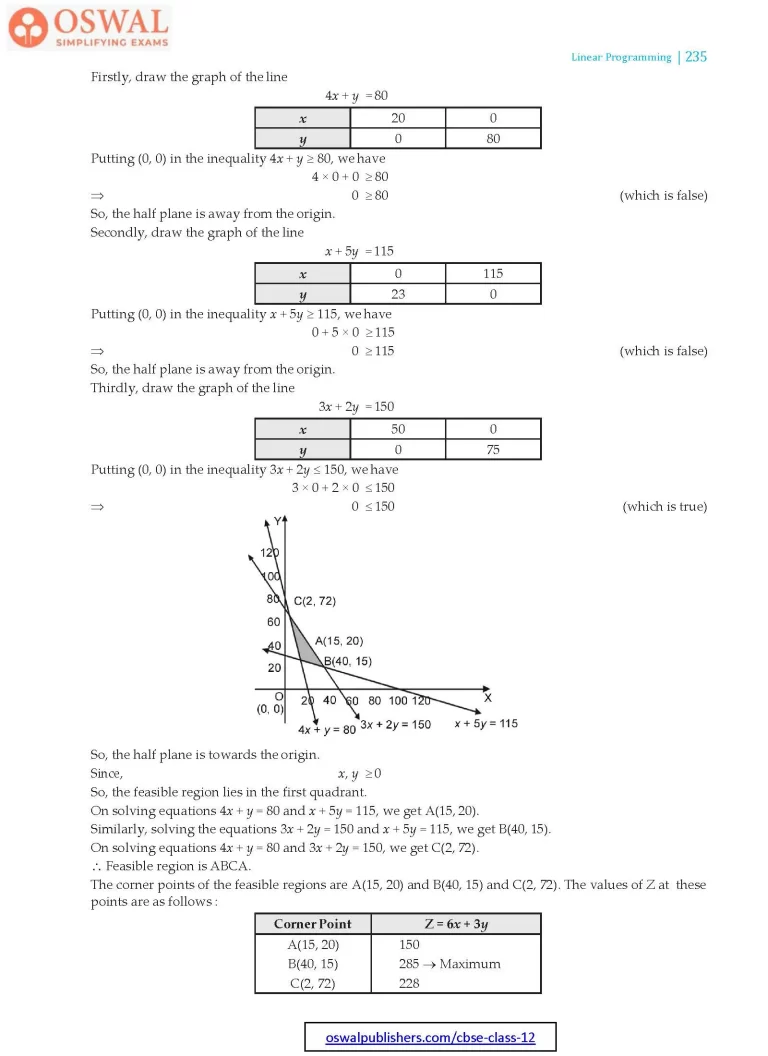
Firstly, draw the graph of the line
4x + y = 80
| x | 20 | 0 |
| y | 0 | 80 |
Putting (0, 0) in the inequality 4x + y ≥ 80, we have
4 × 0 + 0 ≥ 80
⇒ 0 ≥ 80 (which is false)
So, the half plane is away from the origin.
Secondly, draw the graph of the line
x + 5y = 115
| x | 0 | 115 |
| y | 23 | 0 |
Putting (0, 0) in the inequality x + 5y ≥ 115, we have
0 + 5 × 0 ≥ 115
⇒ 0 ≥ 115 (which is false)
So, the half plane is away from the origin.
Thirdly, draw the graph of the line
3x + 2y = 150
| x | 50 | 0 |
| y | 0 | 75 |
Putting (0, 0) in the inequality 3x + 2y ≤ 150, we have
3 × 0 + 2 × 0 ≤ 150
⇒ 0 ≤ 150 (which is true)

So, the half plane is towards the origin.
Since, x, y ≥ 0
So, the feasible region lies in the first quadrant.
On solving equations 4x + y = 80 and x + 5y = 115, we get A(15, 20).
Similarly, solving the equations 3x + 2y = 150 and x + 5y = 115, we get B(40, 15).
On solving equations 4x + y = 80 and 3x + 2y = 150, we get C(2, 72).
∴ Feasible region is ABCA.
The corner points of the feasible regions are A(15, 20) and B(40, 15) and C(2, 72). The values of Z at these points are as follows :
| Corner Point | Z = 6x + 3y |
| A(15, 20) | 150 |
| B(40, 15) | $$285\xrightarrow{}\text{Maximum}$$ |
| C(2, 72) | 228 |
Thus, the maximum value of Z is 285 at B(40, 15).
Therefore, to maximize the amount of vitamin A in the diet, 40 packets of food P and 15 packets of food Q should be used. The maximum amount of vitamin A in the diet is 228 units.
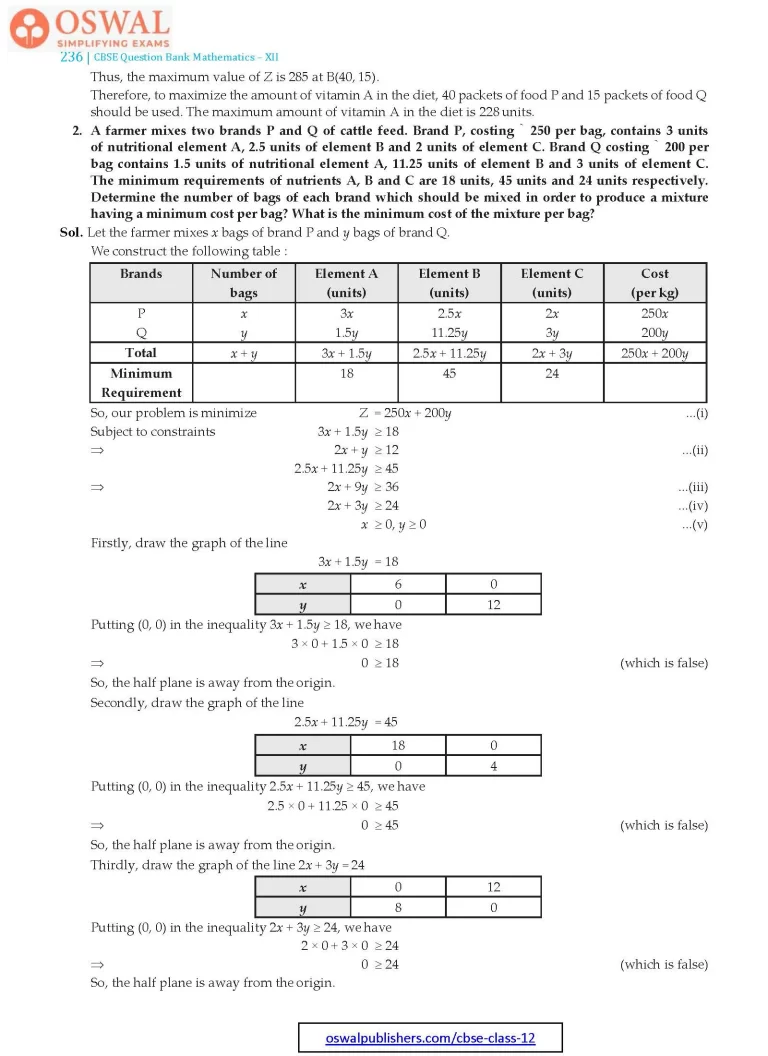
2. A farmer mixes two brands P and Q of cattle feed. Brand P, costing ₹ 250 per bag, contains 3 units of nutritional element A, 2.5 units of element B and 2 units of element C. Brand Q costing ₹ 200 per bag contains 1.5 units of nutritional element A, 11.25 units of element B and 3 units of element C. The minimum requirements of nutrients A, B and C are 18 units, 45 units and 24 units respectively. Determine the number of bags of each brand which should be mixed in order to produce a mixture having a minimum cost per bag? What is the minimum cost of the mixture per bag?
Sol. Let the farmer mixes x bags of brand P and y bags of brand Q.
We construct the following table :
| Brands | Number of bags | Element A (units) | Element B (units) | Element C (units) | Cost (per kg) |
| P Q |
x y |
3x 1.5y |
2.5x 11.25y |
2x 3y |
250x 200y |
| Total | x + y | 3x + 1.5y | 2.5x + 11.25y | 2x + 3y | 250x + 200y |
| Minimum Requirement |
18 | 45 | 24 |
So, our problem is minimize
Z = 250x + 200y ...(i)
Subject to constraints
3x + 1.5y ≥ 18
⇒ 2x + y ≥ 12 ...(ii)
2.5x + 11.25y ≥ 45
⇒ 2x + 9y ≥ 36 ...(iii)
2x + 3y ≥ 24 ...(iv)
x ≥ 0, y ≥ 0 ...(v)
Firstly, draw the graph of the line
3x + 1.5y = 18
| x | 6 | 0 |
| y | 0 | 12 |
Putting (0, 0) in the inequality 3x + 1.5y ≥ 18, we have
3 × 0 + 1.5 × 0 ≥ 18
⇒ 0 ≥ 18 (which is false)
So, the half plane is away from the origin.
Secondly, draw the graph of the line
2.5x + 11.25y = 45
| x | 18 | 0 |
| y | 0 | 4 |
Putting (0, 0) in the inequality 2.5x + 11.25y ≥ 45, we have
2.5 × 0 + 11.25 × 0 ≥ 45
⇒ 0 ≥ 45 (which is false)
So, the half plane is away from the origin.
Thirdly, draw the graph of the line 2x + 3y = 24
| x | 0 | 12 |
| y | 8 | 0 |
Putting (0, 0) in the inequality 2x + 3y ≥ 24, we have
2 × 0 + 3 × 0 ≥ 24
⇒ 0 ≥ 24 (which is false)
So, the half plane is away from the origin.
Since, x, y ≥ 0
So, the feasible region lies in the first quadrant.
On solving equations 3x + 1.5y = 18 and 2x + 3y = 24, we get C(3, 6).
Similarly, on solving equations 2.5x + 11.25y = 45 and 2x + 3y = 24, we get B(9, 2).

The corner points of the feasible region are A(18, 0), B(9, 2), C(3, 6) and D(0, 12). The values of Z at these points are as follows :
| Corner Point | Z = 250x + 200y |
| A(18, 0) | 4500 |
| B(9, 2) | 2650 |
| C(3, 6) | $$1950\xrightarrow{}\text{Minimum}$$ |
| D(0, 12) | 2400 |
As the feasible region is unbounded, therefore, 1950 may or may not be the minimum value of Z.
For this, we draw a graph of the inequality 250x + 200y < 1950 or 5x + 4y < 39 and check, whether the resulting half plane has points in common with the feasible region or not.
It can be seen that the feasible region has no common point with 5x + 4y < 39.
Therefore, the minimum value of Z is 1950 at C(3, 6).
Thus, 3 bags of brand P and 6 bags of brand Q should be used in the mixture to minimize the cost to ₹ 1950.
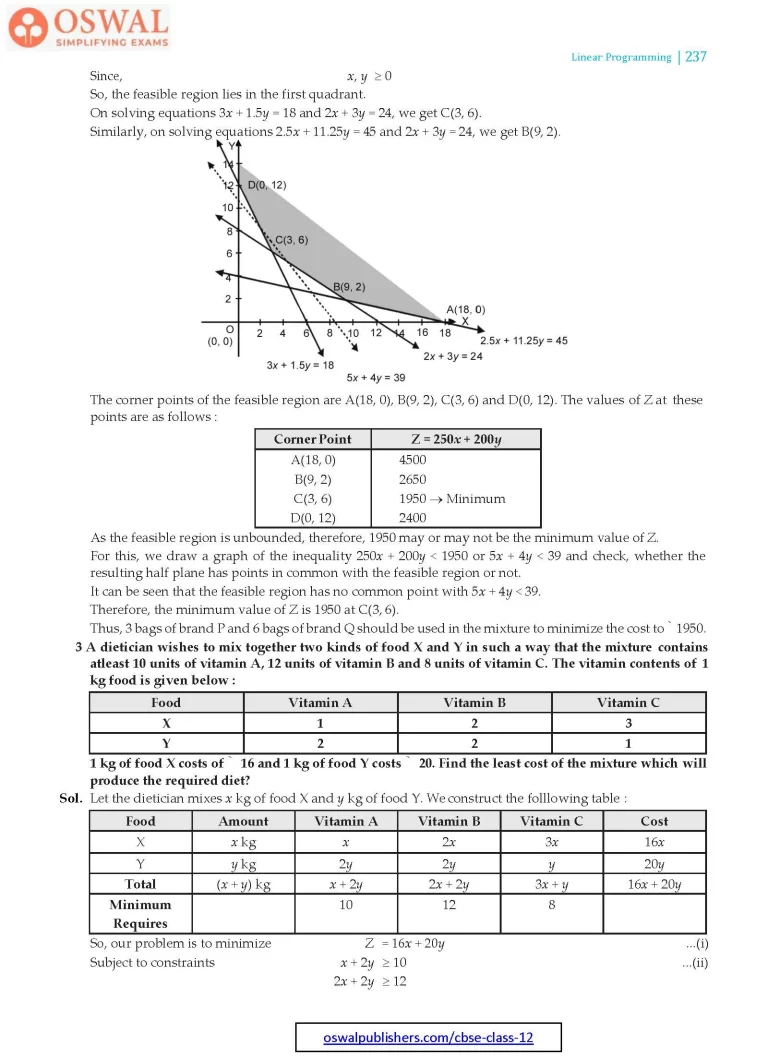
3 A dietician wishes to mix together two kinds of food X and Y in such a way that the mixture contains atleast 10 units of vitamin A, 12 units of vitamin B and 8 units of vitamin C. The vitamin contents of 1 kg food is given below :
| Food | Vitamin A | Vitamin B | Vitamin C |
| X | 1 | 2 | 3 |
| Y | 2 | 2 | 1 |
1 kg of food X costs of ₹ 16 and 1 kg of food Y costs ₹ 20. Find the least cost of the mixture which will produce the required diet?
Sol. Let the dietician mixes x kg of food X and y kg of food Y. We construct the folllowing table :
| Food | Amount | Vitamin A | Vitamin B | Vitamin C | Cost |
| X | x kg | x | 2x | 3x | 16x |
| Y | y kg | 2y | 2y | y | 20y |
| Total | (x + y) kg | x + 2y | 2x + 2y | 3x + y | 16x + 20y |
| Minimum Requires |
10 | 12 | 8 |
So, our problem is to minimize
Z = 16x + 20y ...(i)
Subject to constraints
x + 2y ≥ 10 ...(ii)
2x + 2y ≥ 12
$$\Rarr\space x+y\geq6\space\qquad\text{...(iii)}$$
3x + y ≥ 8 ...(iv)
x ≥ 0, y ≥ 0 ...(v)
Firstly, draw the graph of the line
x + 2y = 10
| x | 0 | 10 |
| y | 5 | 0 |
Putting (0, 0) in the inequality x + 2y ≥ 10, we have
0 + 2 × 0 ≥ 10
⇒ 0 ≥ 10 (which is false)
So, the half plane is away from the origin.
Secondly, draw the graph of the line
x + y = 6
| x | 0 | 6 |
| y | 6 | 0 |
Putting (0, 0) in the inequality x + y ≥ 6, we have
0 + 0 ≥ 6
⇒ 0 ≥ 6 (which is false)
So, the half plane is away from the origin.
Thirdly draw the graph of the line 3x + y = 8
| x | 0 | $$\frac{8}{3}$$ |
| y | 8 | 0 |
Putting (0, 0) in the inequality 3x + y ≥ 8, we have
3 × 0 + 0 ≥ 8
⇒ 0 ≥ 8 (which is false)
So, the half plane is away from the origin.
Since, x, y ≥ 0
So, the feasible region lies in the first quadrant.
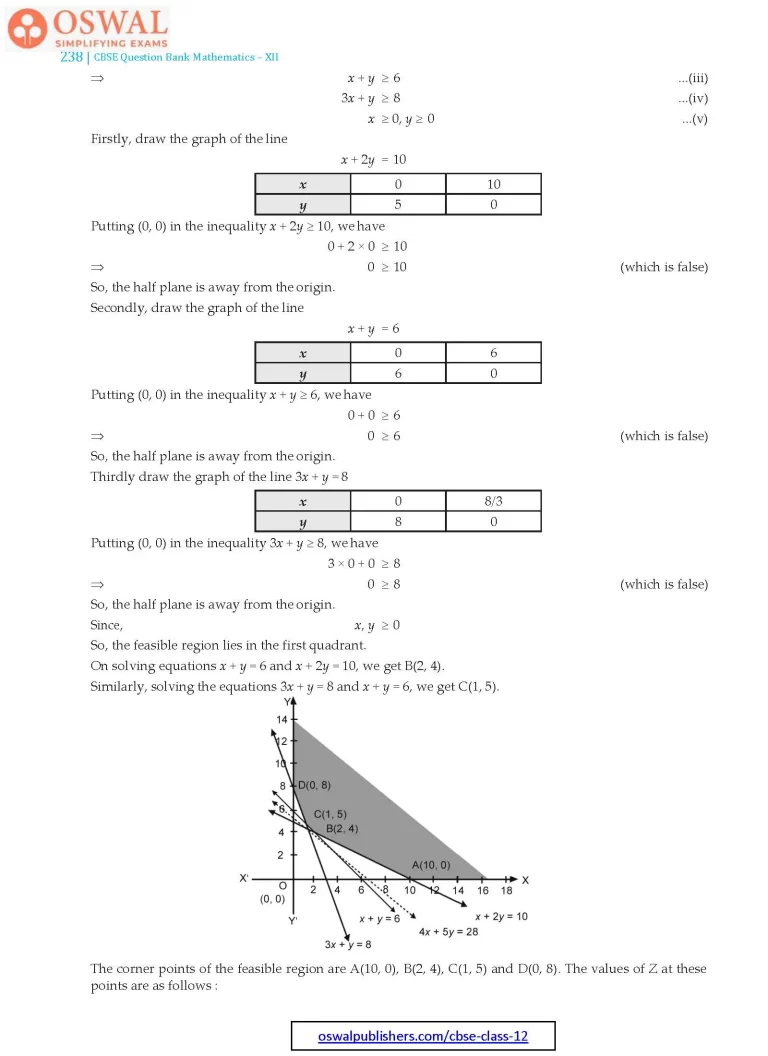
On solving equations x + y = 6 and x + 2y = 10, we get B(2, 4).
Similarly, solving the equations 3x + y = 8 and x + y = 6, we get C(1, 5).

The corner points of the feasible region are A(10, 0), B(2, 4), C(1, 5) and D(0, 8). The values of Z at these points are as follows :
| Corner Point | Z = 16x + 20y |
| A(10, 0) | 160 |
| B(2, 4) | $$112\xrightarrow{}\text{Minimum}$$ |
| C(1, 5) | 116 |
| D(0, 8) | 160 |
As the feasible region is unbounded, therefore, 112 may or may not be the minimum value of Z.
For this, we draw a graph of the inequality, 16x + 20y < 112 or 4x + 5y < 28 and check, whether the resulting half plane has points in common with the feasible region or not.
It can be seen that the feasible region has no common point with 4x + 5y < 28.
Therefore, the minimum value of Z is 112 at B(2, 4).
Thus, the mixture should contain 2 kg of food X and 4 kg of food Y. The minimum cost of the mixture is ₹ 112.
4. A manufacturer make two types of toys A and B. Three machines are needed for this purpose and the time (in minutes) required for each toy on the machine is given below :
| Types of toys | |||
| I | II | III | |
| A | 12 | 18 | 6 |
| B | 6 | 0 | 9 |
| Type of Toys | Number of toys | Time of machine I (in min) | Time of machine II (in min) | Time of machine III (in min) | Profit (in ₹) |
| A B |
x kg y kg |
12x 6y |
18x 0y |
6x 9y |
7.50x 5y |
| Total | x + y | 12x + 6y | 18x + 0y | 6x + 9y | 7.50x + 5y |
| Maximum requires |
6 × 60 = 360 | 6 × 60 = 360 | 6 × 60 = 360 |
Each machine is available for a maximum of 6 hours per day. If the profit on each toy of type A is ₹ 7.50 and that on each toy of type B is ₹ 5, show that 15 toys of type A and 30 toys of type B should be manufactured in a day to get maximum profit.
Sol. Let the manufacturer makes x toys of type A and y toys of type B. We construct the following table :
Our problem is to maximize
Z = 7.50x + 5y ...(i)
Subject to constraints
12x + 6y ≤ 360
⇒ 2x + y ≤ 60 ...(ii)
⇒ 18x ≤ 360
⇒ x ≤ 20 ...(iii)
6x + 9y ≤ 360
⇒ 2x + 3y ≤ 120 ...(iv)
x ≥ 0, y ≥ 0 ...(v)
Firstly, draw the graph of the line
2x + y = 60
| x | 0 | 30 |
| y | 60 | 0 |
Putting (0, 0) in the inequality 2x + y ≤ 60, we have
2 + 0 × 0 ≤ 60
⇒ 0 ≤ 60 (which is true)
So, the half plane is towards the origin.
Secondly draw the graph of the line
2x + 3y = 120
| x | 0 | 60 |
| y | 40 | 0 |
Putting (0, 0) in the inequality 2x + 3y ≤ 120, we have
2 × 0 + 3 × 0 ≤ 120
⇒ 0 ≤ 120 (which is true)
So, the half plane is towards the origin.
Thirdly, draw the graph of the line x = 20.
Putting (0, 0) in the inequality x ≤ 20, we have
0 ≤ 20 (which is true)
So, the half plane is towards the origin.
Since, x, y ≥ 0
So, the feasible region lies in the first quadrant.
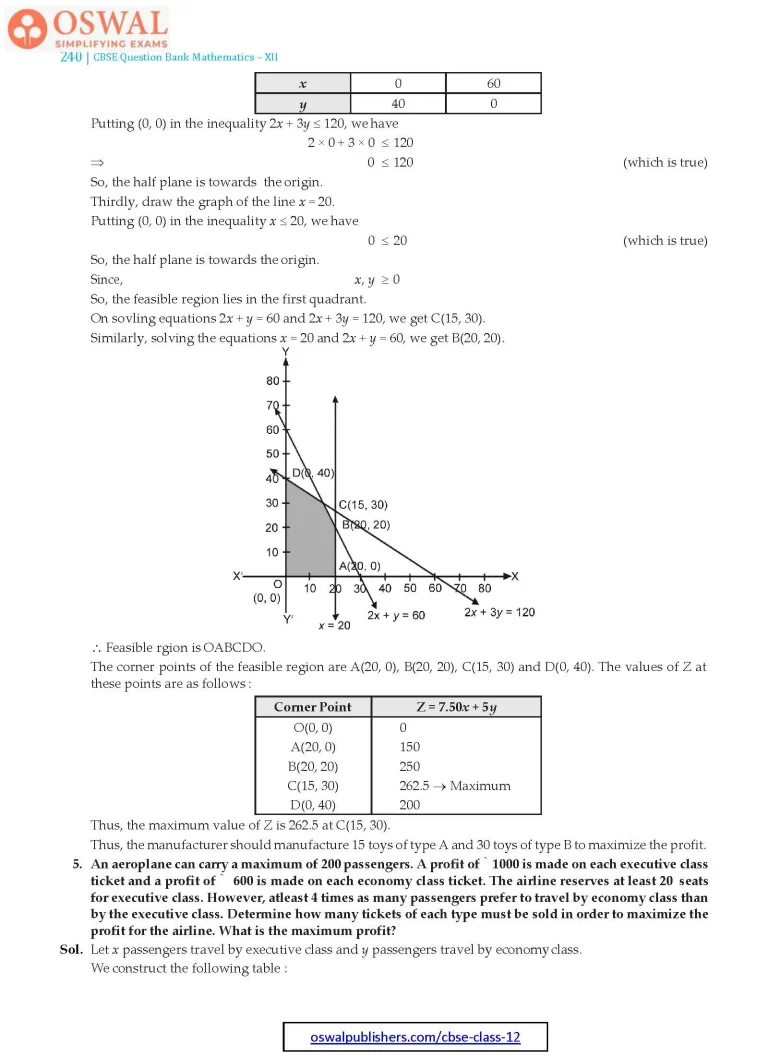
On sovling equations 2x + y = 60 and 2x + 3y = 120, we get C(15, 30).
Similarly, solving the equations x = 20 and 2x + y = 60, we get B(20, 20).

∴ Feasible rgion is OABCDO.
The corner points of the feasible region are A(20, 0), B(20, 20), C(15, 30) and D(0, 40). The values of Z at these points are as follows :
| Corner Point | Z = 7.50x + 5y |
| O(0, 0) | 0 |
| A(20, 0) | 150 |
| B(20, 20) | 250 |
| C(15, 30) | $$262.5\xrightarrow{}\text{Maximum}$$ |
| D(0, 40) | 200 |
Thus, the maximum value of Z is 262.5 at C(15, 30).
Thus, the manufacturer should manufacture 15 toys of type A and 30 toys of type B to maximize the profit.
5. An aeroplane can carry a maximum of 200 passengers. A profit of ` 1000 is made on each executive class ticket and a profit of ` 600 is made on each economy class ticket. The airline reserves at least 20 seats for executive class. However, atleast 4 times as many passengers prefer to travel by economy class than by the executive class. Determine how many tickets of each type must be sold in order to maximize the profit for the airline. What is the maximum profit?
Sol. Let x passengers travel by executive class and y passengers travel by economy class.
We construct the following table :
| Class | Number of tickets | Profit (in ₹) |
| Executive | x | 1000x |
| Economy | y | 600y |
| Total | x+y | 1000x + 600y |
So, our problem is to maximize
Z = 1000x + 600y ...(i)
Subject to constraints
x + y ≤ 200 ...(ii)
x ≥ 20 ...(iii)
y – 4x ≥ 0
⇒ y ≥ 4x ...(iv)
x ≥ 0, y ≥ 0 ...(v)
Firstly, draw the graph of the line
x + y = 200
| x | 0 | 200 |
| y | 200 | 0 |
Putting (0, 0) in the inequality x + y ≤ 200, we have
0 + 0 ≤ 200
⇒ 0 ≤ 200 (which is true)
So, the half plane is towards the origin.
Secondly, draw the graph of the line
y = 4x
| x | 0 | 20 |
| y | 0 | 80 |
Putting (0, 0) in the inequality y ≥ 4x, we have
0 ≥ 4 × 10
⇒ 0 ≥ 40 (which is false)
So, the half plane is away from the origin.
Thirdly, draw the graph of the line x = 20.
Putting (0, 0) in the inequality x ≥ 20, we have
0 ≥ 20 (which is false)
So, the half plane is away from the origin.
Since, x, y ≥ 0
So, the feasible region lies in the first quadrant.
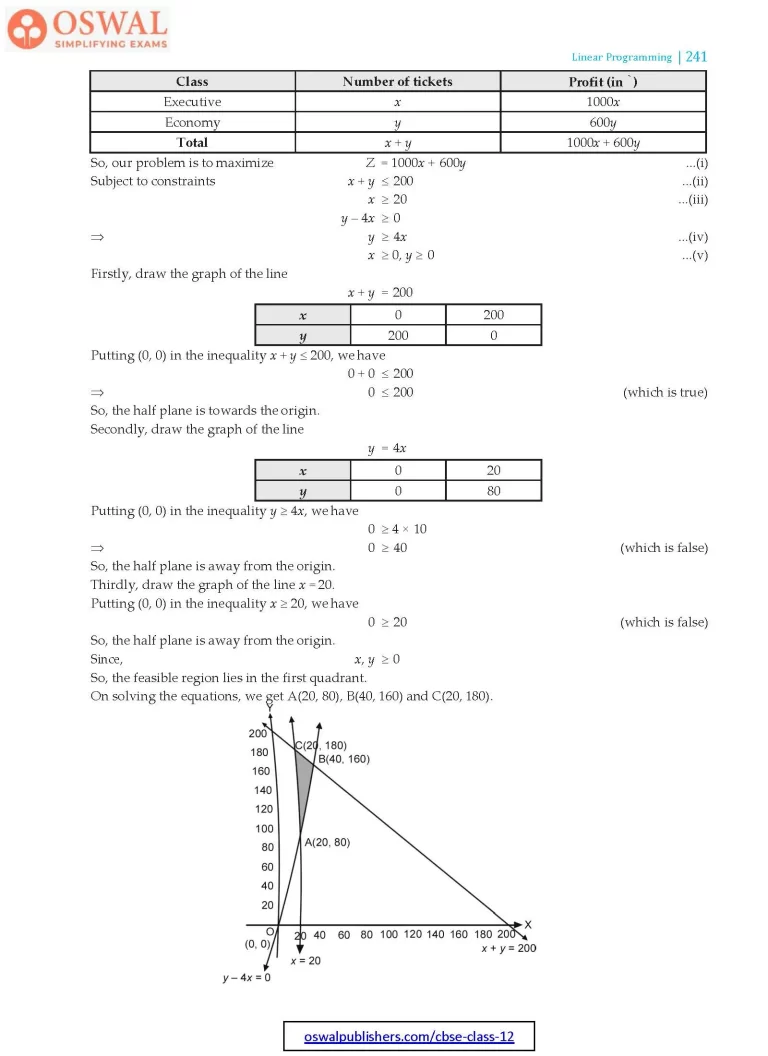
On solving the equations, w e get A(20, 80), B(40, 160) and C(20, 180).

∴ Feasible region is ABCA.
The corner points of the feasible region are A(20, 80), B(40, 160) and C(20, 180).
The value of Z at these points are as follows :
| Corner Point | 1000x + 600y |
| A(20, 80) | 68000 |
| B(40, 160) | $$136000\xrightarrow{}\text{Maximum}$$ |
| C(20, 180) | 128000 |
Thus, the maximum value of Z is 136000 at B(40, 160).
Thus, 40 tickets of executive class and 160 tickets of economy class should be sold to maximize the profit and the maximum profit is ₹ 136000.
6. Two godowns A and B have grain capacities of 100 quintals and 50 quintals respectively. They supply to 3 ration shops, D, E and F, whose requirements are 60, 50 and 40 quintals respectively. The cost of transportation per quintal from the godowns to the shops are given in the following table :
| From/To | A | B |
| D | 6 | 4 |
| E | 3 | 2 |
| F | 2.50 | 3 |
How should the supplies be transported in order that the transporation cost is minimum. What is the minimum cost?
Sol. Let godown A supplies x and y quintals of grain to the shops D and E respectively.
Then, (100 – x – y) will be supplied to shop F.
The requirements at shop D is 60 quintals, since x quintals are transported from godown A. Therefore, the remaining (60 – x) quintals are transported from godown B. Similarly, (50 – y) quintals and 40 – (100 – x – y) = (x + y – 60) quintals will be transported from godown B to shops E and F respectively. The given problem can be represented diagrammatically as follows :
Let Z be the total cost of transportation then,
Z = 6x + 3y + 2.50(100 – x – y) + 4(60 – x) + 2(50 – y) + 3[(x + y) – 60)]
= 6x + 3y + 250 – 2.5x – 2.5y + 240 – 4x + 100 – 2y + 3x + 3y – 180
= 2.50x + 1.50y + 410 ...(i)

Subject to constraints are 60 – x ≥ 0
⇒ x ≤ 60 ...(ii)
50 – y ≥ 0
⇒ y ≤ 50 ...(iii)
100 – (x + y) ≥ 0
⇒ x + y ≤ 100 ...(iv)
x + y – 60 ≥ 0
⇒ x + y ≥ 60 ...(v)
x ≥ 0, y ≥ 0 ...(vi)
Firstly, draw the graph of the line
x + y = 100
| x | 0 | 100 |
| y | 100 | 0 |
Putting (0, 0) in the inequality x + y ≤ 100, we have
0 + 0 ≤ 100
⇒ 0 ≤ 100 (which is true)
So, the half plane is towards the origin.
Secondly, draw the graph of the line
x = 60
Putting (0, 0) in the inequality x + y ≤ 60, we have
0 ≤ 60 (which is true)
So, the half plane is towards the origin.
Thirdly, draw the graph of the line x + y = 60.
| x | 0 | 60 |
| y | 60 | 0 |
Putting (0, 0) in the inequality x + y ≥ 60, we have
0 + 0 ≥ 60
⇒ 0 ≥ 60 (which is false)
So, the half plane is away from the origin.
Fourthly, draw the graph of the line y = 50
Putting (0, 0) in the inequality y ≤ 50, we have
0 ≤ 50 (which is true)
So, the half plane is towards the origin.
Since, x, y ≥ 0
So, the feasible region lies in the first quadrant.

The intersection points of the given lines are A(60, 0), B(60, 40), C(50, 50) and D(10, 50).
∴ Feasible region is ABCDA.
The corner points of the feasible region are A(60, 0), B(60, 40), C(50, 50) and D(10, 50).
The value of Z at these points are as follows :
| Corner Point | Z = 2.5x + 1.5y + 410 |
| A(60, 0) | 560 |
| B(60, 40) | 620 |
| C(50, 50) | 610 |
| D(10, 50) | $$510\xrightarrow{}\text{Minimum}$$ |
The minimum value of Z is 510 at D(10, 50).
Thus, the amount of grain transported from A to D, E and F is 10 qunitals, 50 quintals and 40 quintals respectively and from B to D, E and F is 50 qunitals, 0 qunitals and 0 quintal respectively.
The minimum cost is ₹ 510.
7. An oil company has two depots A and B with capacities of 7000 L and 4000 L respectively. The company is to supply oil to three petrol pumps D, E and F, whose requirements are 4500 L, 3000 L and 3500 L respectively. The distance (in km) between the depots and the petrol pumps is given in the following table :
| From/To | A | B |
| D | 7 | 3 |
| E | 6 | 4 |
| F | 3 | 2 |
Assuming that the transportation cost of 10 L of oil is ₹ 1 per km. How should that delivery be scheduled in order that the transportation cost is minimum? What is the minimum cost?
Sol. Let x and y L of oil be supplied from A to the petrol pumps, D and E. Then, (7000 – x – y) will be supplied from A to petrol pump F. The requirement at petrol pump D is 4500 L. Since, x L are transported from depot A, the remaining (4500 – x) L will be transported from petrol pump B.
Similarly, (3000 – y) L and 3500 – (7000 – x – y) = (x + y – 3500) L will be transported from depot B to petrol pump E and F respectively. The given problem can be represented diagrammatically as follows :
∴ Transportation cost of 10 L is ₹ 1 per km.
$$\therefore\space\text{Transportation of 1 L is}\space\frac{1}{10}\text{per km.}$$

Let Z be the total cost of transporation then,
$$Z = \frac{7}{10}x + \frac{6}{10}y + \frac{3}{10}(7000-x-y)\\+\frac{3}{10}(4500-x) +\frac{4}{10}(3000-y) + \\\frac{2}{10}(x + y-3500)$$
= 0.3x + 0.1y + 3950
So, our problem is to minimize,
Z = 0.3x + 0.1y + 3950 ...(i)
Subject to constraints are
4500 – x ≥ 0
$$\Rarr\space x\leq4500\space\text{...(ii)}\\\text{3000 – y}\geq0\\\Rarr\space\text{y}\leq\text{3000}\space\text{...(iii)}$$
x + y – 3500 ≥ 0
$$\Rarr\space x +y\geq 3500\space\text{...(iv)}$$
7000 – x – y ≥ 0
$$7000-x-y\geq 0 \\\Rarr\space x + y\leq 7000\space\text{...(v)}\\ x\geq 0 , y\geq 0\space\text{...(vi)}$$
Firstly, draw the graph of the line
x + y = 7000
| x | 0 | 7000 |
| y | 7000 | 0 |
Putting (0, 0) in the inequality x + y ≤ 7000, we have
0 + 0 ≤ 100
⇒ 0 ≤ 7000 (which is true)
So, the half plane is towards the origin.
Secondly, draw the graph of the line
x = 4500
Putting (0, 0) in the inequality x ≤ 4500, we have
0 ≤ 4500 (which is true)
So, the plane is towards the origin.
Thirdly, draw the graph of the line x + y = 3500
| x | 3500 | 0 |
| y | 0 | 3500 |
Putting (0, 0) in the inequality x + y ≥ 3500, we have
0 + 0 ≥ 3500
⇒ 0 ≥ 3500 (which is false)
So, the half plane is away from the origin.
Fourthly, draw the graph of the line y = 3000
Putting (0, 0) in the inequality y ≤ 3000, we have
0 ≤ 3000 (which is true)

So, the half plane is towards the origin.
Since, x, y ≥ 0
So, the feasible region lies in the first quadrant.
The intersection points of the given lines are C(4500, 2500), D(4500, 3000), and E(500, 3000).
∴ Feasible region is ABCDEA.
The corner points of the feasible region are A(3500, 0), B(4500, 0), C(4500, 2500), D(4500, 3000) and E(500, 3000).
The value of Z at these points are as follows :
The minimum value of Z is 4400 at E(500, 3000).
Thus, the oil supplied from depot A is 500 L, 3000 L and 3500 L and from depot B is 4000 L, 0 L and 0 L to petrol pumps D, E and F respectively.
The minimum transportation cost is ₹ 4400.
| Corner Point | Z = 0.3x + 0.1y + 3950 |
| A(3500, 0) | 5000 |
| B(4500, 0) | 5300 |
| C(4500, 2500) | 5550 |
| D(4500, 3000) | 5600 |
| E(500, 3000) | $$4400\xrightarrow{}\text{Minimum}$$ |
8. A fruit grower can use two types of fertilizer in his garden, brand P and brand Q. The amounts (in kg) of nitrogen, phosphoric acid, potash and chlorine in a bag of each brand are given in the table. Tests indicate that the garden needs atleast 240 kg of phosphoric acid, atleast 270 kg of potash and at most 310 kg of chlorine.
If the grower wants to minimize the amount of nitrogen added to the garden, how many bags of each should be used. What is the minimum amount of nitrogen added in the garden?
Sol. Let the fruit grower mixes x bags of brand P and y bags of brand Q. Construct the following table :
| Brand P | Brand Q | |
| Nitrogen | 3 | 3.5 |
| Phosphoric acid | 1 | 2 |
| Potash | 3 | 1.5 |
| Chlorine | 1.5 | 2 |
| Brand of fertilizer | Number of bags | Amount of nitrogen | Amount of phosphoric acid | Amount of potash | Amount of chlorine |
| P Q |
x y |
3x 3.5y |
x 2x |
3x 1.5y |
1.5y 2y |
| Total | x + y | 3x + 3.5y | x + 2y | 3x + 1.5y | 1.5x + 2y |
Our problem is to maximize,
Z = 3x +3.5y ...(i)
Subject to constraints are
x + 2y ≥ 240 ...(ii)
3x + 1.5y ≥ 270 ...(iii)
1.5x + 2y ≤ 310 ...(iv)
x ≥ 0, y ≥ 0 ...(v)
Firstly, draw the graph of the line
x + 2y = 240
| x | 0 | 240 |
| y | 120 | 0 |
Putting (0, 0) in the inequality x + 2y ≥ 240, we have
0 + 2× 0 ≥ 240
⇒ 0 ≥ 240 (which is false)
So, the half plane is away from the origin.
Secondly, draw the graph of the line
3x + 1.5y = 270
| x | 0 | 90 |
| y | 180 | 0 |
Putting (0, 0) in the inequality 3x + 1.5y ≥ 270, we have
3 × 0 + 1.5 × 0 ≥ 270
⇒ 0 ≥ 270 (which is false)
So, the half plane is away from the origin.
Thirdly, draw the graph of the line
1.5x + 2y = 310
Putting (0, 0) in the inequality 1.5x + 2y ≤ 310, we have
1.5 × 0 + 2 × 0 ≤ 310
⇒ 0 ≤ 310 (which is true)
| x | 0 | $$\frac{620}{3}$$ |
| y | 155 | 0 |

So, the half plane is towards the origin.
Since, x, y ≥ 0
So, the feasible region lies in the first quadrant.
Let Z be the total cost.
On solving equations 1.5x + 2y = 310 and x + 2y = 240, we get A(140, 50).
Similarly, on solving equations 3x + 1.5y = 270 and 1.5x + 2y = 310, we get B(20, 140).
∴ Feasible region is ABCA.
The corner points of the feasible region are A(140, 50), B(20, 140) and C(40, 100).
The value of Z at these points are as follows :
| Corner Point | Z = 3x + 3.5y |
| A(140, 50) | 595 |
| B(20, 140) | 550 |
| C(40, 100) | $$470\xrightarrow{}\text{Minimum}$$ |
The minimum value of Z is 470 at C(40, 100).
Thus, 40 bags of brand P and 100 bags of brand Q should be added to the garden to minimize the amount of nitrogen.
The minimum amount of nitrogen added to the garden is 470 kg.
9. A fruit grower can use two types of fertilizer in his garden, brand P and brand Q. The amounts (in kg) of nitrogen, phosphoric acid, potash and chlorine in a bag of each brand are given in the table. Tests indicate that the garden needs atleast 240 kg of phosphoric acid, atleast 270 kg of potash and at most 310 kg of chlorine. If the grower wants to maximize the amount of nitrogen added to the garden, how many bags of each brand should be added? What is the maximum amount of nitrogen added?
| Brand P | Brand Q | |
| Nitrogen | 3 | 3.5 |
| Phosphoric acid | 1 | 2 |
| Potash | 3 | 1.5 |
| Chorine | 1.5 | 2 |
Sol. Let the fruit grower mixes x bags of brand P and y bags of brand Q.
Construct the following table :
| Brand of fertilizer | Number of bags | Amount of nitrogen | Amount of phosphoric acid | Amount of potash | Amount of chlorine |
| P Q |
x y |
3x 3.5y |
1x 2y |
3x 1.5y |
1.5x 2y |
| Total | x + y | 3x + 3.5y | x + 2y | 3x + 1.5y | 1.5x + 2y |
Our problem is to maximize
Z = 3x +3.5y ...(i)
Subject to constraints are
x + 2y ≥ 240 ...(ii)
3x + 1.5y ≥ 270 ...(iii)
1.5x + 2y ≤ 310 ...(iv)
x ≥ 0, y ≥ 0 ...(v)
Firstly, draw the graph of the line
x + 2y = 240
| x | 0 | 240 |
| y | 120 | 0 |
Putting (0, 0) in the inequality x + 2y ≥ 240, we have
0 + 2 × 0 ≥ 240
⇒ 0 ≥ 240 (which is false)
So, the half plane is towards the origin.
Secondly, draw the graph of the line
3x + 1.5y = 270
| x | 0 | 90 |
| y | 180 | 0 |
Putting (0, 0) in the inequality 3x + 1.5y ≥ 270, we have
3 × 0 + 1.5 × 0 ≥ 270
⇒ 0 ≥ 270 (which is false)
So, the half plane is away from the origin.
Thirdly draw the graph of the line 1.5x + 2y = 310
| x | 0 | $$\frac{620}{3}$$ |
| y | 155 | 0 |
Putting (0, 0) in the inequality 3x + 1.5y ≤ 310, we have
1.5 × 0 + 2 × 0 ≤ 310
⇒ 0 ≤ 310 (which is true)
So, the half plane is towards the origin.
The intersection point of lines 3x + 1.5y = 270 and 1.5x + 2y = 310 is B(20, 140); of lines 1.5x + 2y = 310 and x + 2y = 240 is A(140, 50); of lines x + 2y = 240 and 3x + 1.5y = 270 is C(40, 100).

Since, x, y ≥ 0
So, the feasible region lies in the first quadrant.
Let Z be the total cost.
The corner points of the feasible region are C(40, 100), A(140, 50) and B(20, 10).
The value of Z at these points are as follows :
| Corner Point | Z = 3x + 3.5y |
| A(140, 50) | $$595\xrightarrow{}\text{Maximum}$$ |
| B(20, 140) | 550 |
| C(40, 100) | 470 |
The maximum value of Z is 595 at (140, 50).
Thus, 140 bags of brand P and 50 bags of brand Q should be added to the garden to maximize the amount of nitrogen.
The maximum amount of nitrogen added to the garden is 595 kg.
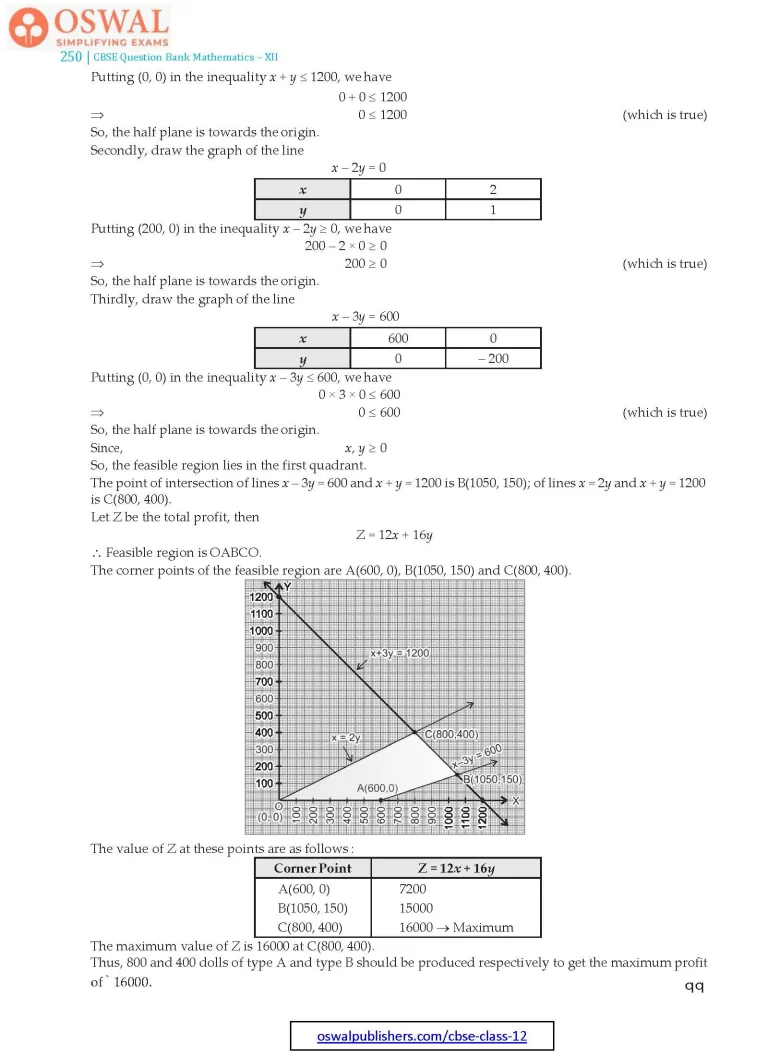
10. A toy company manufactures two types of dolls A and B. Market tests and available resources have indicated that the combined production level should not exceed 1200 dolls per week and the demand for dolls of type B is at most half of that for dolls of type A. Further, the production level of dolls of type A can exceed three times the production of dolls of type B by at most 600 units. If the company makes profit of ₹ 12 and ₹ 16 per doll respectively on dolls A and B, how many of each should be produced weekly in order to maximize the profit?
Sol. Let the company manufactures x dolls of type A and y dolls of type B, then
x ≥ 0, y ≥ 0 ...(i)
x + y ≤ 1200 ...(ii)
y ≤ x/2
⇒ x – 2y ≥ 0 ...(iii)
x ≤ 3y + 600
⇒ x – 3y ≤ 600 ...(iv)
Firstly, draw the graph of the line
x + y = 1200
| x | 1200 | 0 |
| y | 0 | 1200 |
Putting (0, 0) in the inequality x + y ≤ 1200, we have
0 + 0 ≤ 1200
⇒ 0 ≤ 1200 (which is true)
So, the half plane is towards the origin.
Secondly, draw the graph of the line
x – 2y = 0
| x | 0 | 2 |
| y | 0 | 1 |
Putting (200, 0) in the inequality x – 2y ≥ 0, we have
200 – 2 × 0 ≥ 0
⇒ 200 ≥ 0 (which is true)
So, the half plane is towards the origin.
Thirdly, draw the graph of the line
x – 3y = 600
| x | 600 | 0 |
| y | 0 | -200 |
Putting (0, 0) in the inequality x – 3y ≤ 600, we have
0 × 3 × 0 ≤ 600
⇒ 0 ≤ 600 (which is true)
So, the half plane is towards the origin.
Since, x, y ≥ 0
So, the feasible region lies in the first quadrant.
The point of intersection of lines x – 3y = 600 and x + y = 1200 is B(1050, 150); of lines x = 2y and x + y = 1200 is C(800, 400).
Let Z be the total profit, then
Z = 12x + 16y
∴ Feasible region is OABCO.
The corner points of the feasible region are A(600, 0), B(1050, 150) and C(800, 400).

The value of Z at these points are as follows :
| Corner Point | z = 12x + 16y |
| A(600, 0) | 7200 |
| B(1050, 150) | 15000 |
| C(800, 400) | $$16000\xrightarrow{}\text{Maximum}$$ |
The maximum value of Z is 16000 at C(800, 400).
Thus, 800 and 400 dolls of type A and type B should be produced respectively to get the maximum profit of ₹ 16000.
Share page on
NCERT Solutions Class 12 Mathematics
- Chapter 1 Relations and Functions
- Chapter 2 Inverse Trigonometric Functions
- Chapter 3 Matrices
- Chapter 4 Determinants
- Chapter 5 Continuity and Differentiability
- Chapter 6 Application of Derivatives
- Chapter 7 Integrals
- Chapter 8 Applications of the Integrals
- Chapter 9 Differential Equations
- Chapter 10 Vectors
- Chapter 11 Three-Dimensional Geometry
- Chapter 12 Linear Programming
- Chapter 13 Probability
CBSE CLASS 12 NCERT SOLUTIONS
- NCERT Solutions Class 12 English Core
- NCERT Solutions Class 12 Physics
- NCERT Solutions Class 12 Chemistry
- NCERT Solutions Class 12 Biology
- NCERT Solutions Class 12 Business Studies
- NCERT Solutions Class 12 Mathematics
- NCERT Solutions Class 12 Accountancy
- NCERT Solutions Class 12 Economics
- NCERT Solutions Class 12 Geography
- NCERT Solutions Class 12 History
- NCERT Solutions Class 12 Political Science
CBSE CLASS 12 SYLLABUS
- CBSE Class 12 English core Syllabus
- CBSE Class 12 Mathematics Syllabus
- CBSE Class 12 Physics Syllabus
- CBSE Class 12 Chemistry Syllabus
- CBSE Class 12 Biology Syllabus
- CBSE Class 12 Accountancy Syllabus
- CBSE Class 12 Business Studies Syllabus
- CBSE Class 12 Economics Syllabus
- CBSE Class 12 History Syllabus
- CBSE Class 12 Geography Syllabus
- CBSE Class 12 Political science Syllabus
- CBSE Class 12 Sociology Syllabus
- CBSE Class 12 Psychology Syllabus
- CBSE Class 12 Physical education Syllabus
- CBSE Class 12 Applied mathematics Syllabus
- CBSE Class 12 History of Indian Arts Syllabus
CBSE CLASS 12 Notes
- CBSE Class 12 Physics Notes
- CBSE Class 12 Chemistry Notes
- CBSE Class 12 Biology Notes
- CBSE Class 12 Maths Notes
- CBSE Class 12 Accountancy Notes
- CBSE Class 12 Business Studies Notes
- CBSE Class 12 Economics Notes
- CBSE Class 12 History Notes
- CBSE Class 12 Geography Notes
- CBSE Class 12 Political Science Notes
