NCERT Solutions for Class 9 Maths Chapter 14: Statistics
Looking for accurate NCERT Solutions for Class 9 Maths Chapter 14 Statistics PDF Download? This page provides simple and clear answers to help you understand the basics of data handling. The NCERT Solutions for Class 9 Maths Chapter 14 are useful for solving every question step by step. These Statistics Class 9th solutions match the latest CBSE syllabus and exam format.
You will find detailed Class 9 Maths Chapter 14 question answer sets that cover all important topics. These Statistics Class 9 questions and answers help students improve their problem-solving speed and accuracy. With clear explanations and solved examples, the NCERT Solutions for Class 9 Maths Chapter 14 Statistics PDF Download makes revision easy. Download now to get the best Statistics Class 9 questions and answers and practice every Class 9 Maths Statistics question answer with confidence.

NCERT Solutions for Class 9 Mathematics Chapter 14 Free PDF Download
Please Click on Free PDF Download link to Download the NCERT Solutions for Class 9 Mathematics Chapter 14 Statistics
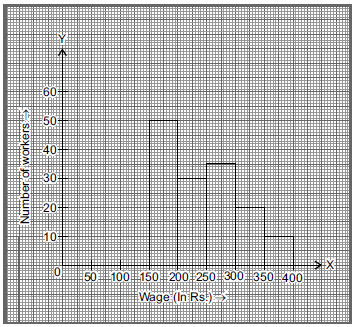
Q. In the given figure, there is a histogram depticting daily wages of workers in a factory. Construct the frequency distribution table.
Ans.
| Class-interval Wages (in ₹) | No. of workers |
| 150 – 200 | 50 |
| 200 – 250 | 30 |
| 250 – 300 | 35 |
| 300 – 350 | 20 |
| 350 – 400 | 10 |
It is the required frequency distribution for given histogram.
Q. Given below are the seats won by different political parties in the polling outcome of a state assembly elections :
| Political party | Seats won |
| A | 75 |
| B | 55 |
| C | 37 |
| D | 29 |
| E | 10 |
| F | 37 |
(i) Draw a bar graph to represent to polling results.
(ii) Which political party won the maximum number of seats?
Ans.
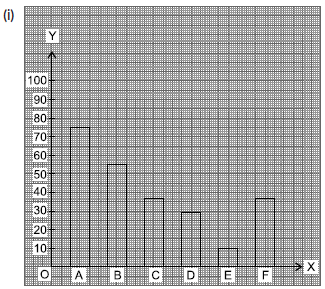
(ii) Party A, was the maximum number of seats as 75.
Q. The following table gives the distribution of students of two sections according to the marks obtained by them :
| Section A | Section B | ||
| Marks | Frequency | Marks | Frequency |
| 0 – 10 | 3 | 0 – 10 | 5 |
| 10 – 20 | 9 | 10 – 20 | 19 |
| 20 – 30 | 17 | 20 – 30 | 15 |
| 30 – 40 | 12 | 30 – 40 | 10 |
| 40 – 50 | 9 | 40 – 50 | 1 |
Represent the marks of the students of both the sections on the same graph by two frequency polygon. From the two polygons compare the performance of the two sections.
Ans.
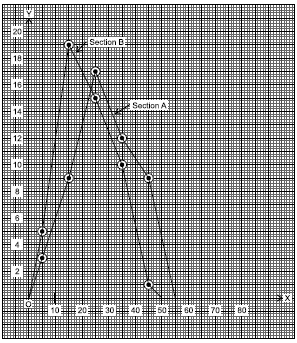
| Section A | Section B | ||||
| Marks | Mid value | Frequency (fA) | Marks | Mid value | fB |
| 0 – 10 | 5 | 3 | 0 – 10 | 5 | 5 |
| 10 – 20 | 15 | 9 | 10 – 20 | 15 | 19 |
| 20 – 30 | 25 | 17 | 20 – 30 | 25 | 15 |
| 30 – 40 | 35 | 12 | 30 – 40 | 35 | 10 |
| 40 – 50 | 45 | 9 | 40 – 50 | 45 | 1 |
Share page on
CBSE CLASS 9 BOOKS